
Wirmighausen


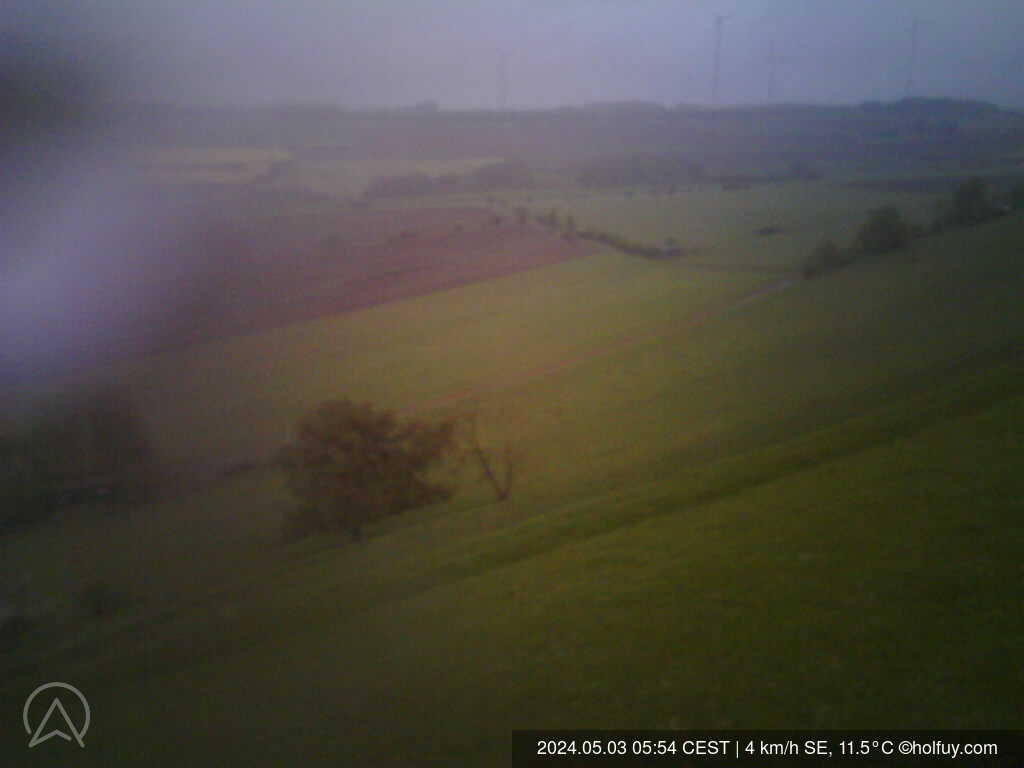
Wirmighausen/Adorf, 465m (AMSL) |SHOW ON MAP|
Papillon Schulungsgeände Wirmighausen
www.sauerlandair.de
08:03-18:13 (CEST)
Papillon Schulungsgeände Wirmighausen
www.sauerlandair.de
08:03-18:13 (CEST)
Page views in 2026: 35061
Note: Calculated from yearly data where the average wind speed is more than 4km/h.
Loading...
Averages updated: 01:56:57 Sat CEST
| Time | 18h | 18:15 | 18:30 | 18:45 | 19h | 19:15 | 19:30 | 19:45 | 20h | 20:15 | 20:30 | 20:45 | 21h | 21:15 | 21:30 | 21:45 | 22h | 22:15 | 22:30 | 22:45 | 23h | 23:15 | 23:30 | 23:45 | Sat | 00:15 | 00:30 | 00:45 | 01h | 01:15 | 01:30 | 01:45 |
| Speed | 35 | 34 | 39 | 33 | 31 | 34 | 34 | 33 | 37 | 36 | 33 | 33 | 35 | 36 | 34 | 32 | 35 | 33 | 34 | 32 | 36 | - | - | - | - | - | - | - | 26 | 23 | 30 | 33 |
| Gust (km/h) | 52 | 49 | 74 | 64 | 61 | 57 | 53 | 49 | 55 | 51 | 52 | 61 | 61 | 57 | 49 | 45 | 53 | 51 | 57 | 52 | 53 | - | - | - | - | - | - | - | 45 | 41 | 46 | 53 |
| Direction | - | - | - | - | - | - | - | |||||||||||||||||||||||||
| Direction Deg. | SSE 157° | SSE 155° | SSE 160° | SSE 163° | SSE 168° | S 169° | SSE 161° | SSE 166° | SSE 163° | SSE 160° | SSE 165° | S 170° | SSE 162° | SSE 167° | SSE 167° | S 173° | S 169° | S 171° | S 173° | S 183° | S 181° | - - | - - | - - | - - | - - | - - | - - | S 189° | S 176° | S 177° | S 182° |
| Temp. (°C) | 8.4 | 8.4 | 8.2 | 8.1 | 8.1 | 8.0 | 8.0 | 8.0 | 7.7 | 7.7 | 7.7 | 7.7 | 7.7 | 7.5 | 7.5 | 7.5 | 7.5 | 7.4 | 7.2 | 7.2 | 7.0 | - | - | - | - | - | - | - | 6.2 | 6.1 | 5.9 | 6.0 |
| Time | 10h | 11h | 12h | 13h | 14h | 15h | 16h | 17h | 18h | 19h | 20h | 21h | 22h | 23h | Fri | 01h | 02h | 03h | 04h | 05h | 06h | 07h | 08h | 09h | 10h | 11h | 12h | 13h | 14h | 15h | 16h | 17h |
| Speed | 20 | 19 | 23 | 24 | 29 | 29 | 23 | 21 | 21 | 24 | 21 | 19 | 19 | 21 | 19 | 20 | 20 | 16 | 22 | 19 | 19 | 24 | 26 | 26 | 28 | 31 | 27 | 30 | 29 | 31 | 29 | 31 |
| Gust (km/h) | 35 | 35 | 44 | 49 | 52 | 61 | 41 | 39 | 32 | 40 | 35 | 29 | 27 | 33 | 29 | 31 | 29 | 26 | 33 | 32 | 32 | 37 | 45 | 44 | 47 | 46 | 47 | 52 | 52 | 52 | 52 | 65 |
| Direction | ||||||||||||||||||||||||||||||||
| Direction Deg. | S 171° | SSE 161° | S 170° | S 177° | S 185° | S 188° | S 175° | S 174° | S 172° | S 171° | SSE 164° | SSE 162° | SSE 164° | SSE 163° | SSE 167° | SSE 165° | SSE 153° | SSE 148° | SSE 154° | SSE 151° | SSE 150° | SSE 149° | SSE 154° | SSE 154° | SSE 154° | SSE 154° | SSE 151° | SE 142° | SSE 150° | SSE 157° | SSE 150° | SSE 150° |
| Temp. (°C) | 5.7 | 6.4 | 7.8 | 9.3 | 10.5 | 9.5 | 8.7 | 8.0 | 7.8 | 7.2 | 7.0 | 7.0 | 7.0 | 7.0 | 6.9 | 7.1 | 6.9 | 7.1 | 7.2 | 7.2 | 7.2 | 7.1 | 7.0 | 6.8 | 7.0 | 7.5 | 8.2 | 7.5 | 9.0 | 10.1 | 9.9 | 9.4 |
Graphs
ZOOM
3 h
6 h
12h
1 d
5 d(max)
Synchronized zoom
updated: 01:56:57 Sat CEST
- Wind speed (km/h)
- Wind direction (°deg)
- Temperature (°C)
- Light
Scroll down or click here to load graphs.
Scroll down or click here to load graphs.
Scroll down or click here to load graphs.
Scroll down or click here to load graphs.