Alpe Quaggione

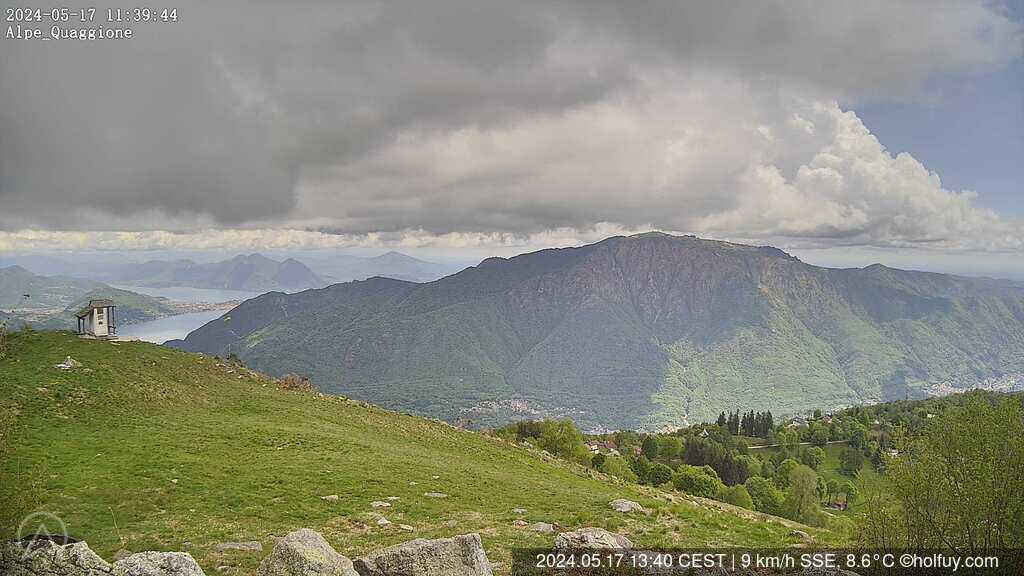
Italy, 1330m (AMSL) |SHOW ON MAP|
Alpe Quaggione
clubvololiberovco(youknowit)gmail.com
06:11-20:53 (CEST)
Alpe Quaggione
clubvololiberovco(youknowit)gmail.com
06:11-20:53 (CEST)
Page views in 2026: 9697
Note: Calculated from yearly data where the average wind speed is more than 4km/h.
Loading...
Averages updated: 11:02:42 Mon CEST
| Time | 03:15 | 03:30 | 03:45 | 04h | 04:15 | 04:30 | 04:45 | 05h | 05:15 | 05:30 | 05:45 | 06h | 06:15 | 06:30 | 06:45 | 07h | 07:15 | 07:30 | 07:45 | 08h | 08:15 | 08:30 | 08:45 | 09h | 09:15 | 09:30 | 09:45 | 10h | 10:15 | 10:30 | 10:45 | 11h |
| Speed | 2 | 2 | 2 | 2 | 2 | 3 | 2 | 2 | 2 | 2 | 2 | 2 | 1 | 3 | 3 | 0 | 1 | 0 | 1 | 2 | 2 | 9 | 8 | 3 | 1 | 1 | 3 | 2 | 2 | 2 | 2 | 1 |
| Gust (km/h) | 5 | 5 | 7 | 8 | 5 | 7 | 5 | 5 | 5 | 5 | 5 | 5 | 7 | 7 | 7 | 2 | 3 | 0 | 5 | 7 | 10 | 21 | 17 | 8 | 5 | 5 | 5 | 5 | 5 | 7 | 5 | 4 |
| Direction | ||||||||||||||||||||||||||||||||
| Direction Deg. | ENE 77° | NE 35° | NNE 27° | N 7° | NNE 14° | NW 322° | NW 314° | NE 45° | NNW 342° | NNW 330° | NNW 347° | N 3° | ENE 71° | E 90° | E 89° | E 89° | E 89° | E 89° | NNE 15° | NW 314° | WNW 283° | SSE 162° | NNW 332° | N 360° | NNW 328° | NNE 13° | ENE 58° | ENE 72° | ENE 65° | E 87° | ESE 112° | WSW 249° |
| Temp. (°C) | 20.9 | 20.9 | 20.9 | 20.7 | 20.5 | 20.3 | 20.2 | 20.2 | 20.2 | 20.3 | 20.5 | 20.5 | 20.4 | 20.6 | 20.8 | 20.8 | 21.2 | 21.5 | 21.4 | 20.9 | 20.9 | 18.6 | 18.5 | 20.2 | 20.8 | 21.1 | 21.2 | 21.8 | 22.3 | 23.7 | 24.9 | 26.2 |
| Time | 20h | 21h | 22h | 23h | Sun | 01h | 02h | 03h | 04h | 05h | 06h | 07h | 08h | 09h | 10h | 11h | 12h | 13h | 14h | 15h | 16h | 17h | 18h | 19h | 20h | 21h | 22h | 23h | Mon | 01h | 02h | 03h |
| Speed | 1 | 2 | 1 | 2 | 6 | 4 | 3 | 2 | 3 | 4 | 6 | 4 | 5 | 1 | 7 | 1 | 3 | 8 | 7 | 5 | 5 | 1 | 3 | 2 | 1 | 3 | 2 | 1 | 1 | 1 | 3 | 2 |
| Gust (km/h) | 4 | 7 | 7 | 7 | 13 | 11 | 11 | 8 | 10 | 8 | 10 | 8 | 9 | 7 | 19 | 8 | 15 | 17 | 17 | 14 | 14 | 8 | 9 | 8 | 5 | 8 | 8 | 5 | 4 | 5 | 9 | 9 |
| Direction | ||||||||||||||||||||||||||||||||
| Direction Deg. | NNE 28° | N 349° | ENE 68° | N 353° | ENE 75° | N 349° | NNE 33° | N 351° | ENE 71° | E 98° | ESE 119° | E 91° | ESE 112° | SSE 151° | E 99° | WSW 255° | NNE 17° | E 90° | ESE 107° | SE 138° | SE 135° | SSE 162° | ESE 122° | N 358° | NNE 17° | NNW 327° | N 357° | N 351° | NE 34° | N 6° | N 11° | NNW 346° |
| Temp. (°C) | 23.2 | 22.7 | 22.6 | 22.6 | 21.6 | 21.0 | 20.9 | 20.7 | 21.3 | 21.1 | 20.7 | 20.5 | 21.0 | 24.2 | 19.6 | 21.9 | 22.7 | 21.5 | 23.1 | 25.2 | 24.4 | 22.4 | 25.2 | 22.8 | 22.3 | 21.4 | 21.1 | 21.3 | 21.3 | 21.2 | 20.9 | 20.7 |
Graphs
ZOOM
3 h
6 h
12h
1 d
5 d(max)
Synchronized zoom
updated: 11:02:42 Mon CEST
- Wind speed (km/h)
- Wind direction (°deg)
- Temperature (°C)
- Standard Pressure (hPa)
Scroll down or click here to load graphs.
Scroll down or click here to load graphs.
Scroll down or click here to load graphs.
Scroll down or click here to load graphs.