BJFF Leinavatn,Troms

Norway, Bardu, Altevatn, Leinavatn, 500m (AMSL) |SHOW ON MAP|
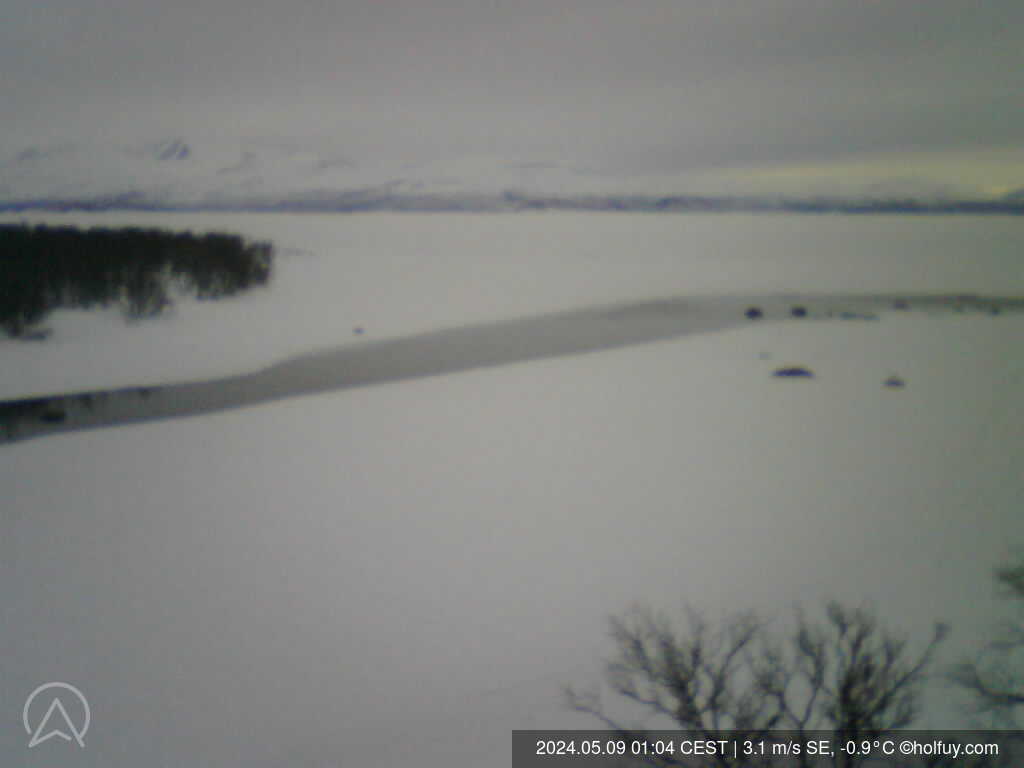
BJFFs hytter på Leinavatn, indre Troms. Ved Geavdnjaelvas utløp.
01:11-00:23 (CEST)
BJFFs hytter på Leinavatn, indre Troms. Ved Geavdnjaelvas utløp.
01:11-00:23 (CEST)
Page views in 2026: 3112
Note: Calculated from yearly data where the average wind speed is more than 4km/h.
Loading...
Averages updated: 06:55:07 Mon CEST
| Time | 23h | 23:15 | 23:30 | 23:45 | Mon | 00:15 | 00:30 | 00:45 | 01h | 01:15 | 01:30 | 01:45 | 02h | 02:15 | 02:30 | 02:45 | 03h | 03:15 | 03:30 | 03:45 | 04h | 04:15 | 04:30 | 04:45 | 05h | 05:15 | 05:30 | 05:45 | 06h | 06:15 | 06:30 | 06:45 |
| Speed | 3.9 | 3.3 | 3.1 | 3.9 | 3.3 | 3.3 | 2.8 | 2.5 | 2.2 | 1.7 | 1.4 | 1.4 | 1.4 | 2.8 | 1.9 | 2.8 | 2.8 | 1.9 | 0.8 | 1.1 | 1.9 | 1.9 | 1.7 | 1.7 | 1.7 | 0.6 | 0.8 | 1.7 | 1.9 | 1.4 | 1.4 | 1.4 |
| Gust (m/s) | 6.1 | 5.3 | 4.4 | 5.8 | 5.6 | 4.7 | 4.7 | 4.2 | 3.9 | 2.8 | 2.8 | 2.5 | 3.1 | 4.4 | 4.2 | 4.7 | 4.7 | 3.6 | 2.2 | 2.2 | 2.5 | 2.8 | 2.8 | 3.6 | 3.1 | 1.4 | 2.8 | 2.8 | 3.1 | 2.8 | 2.5 | 2.8 |
| Direction | ||||||||||||||||||||||||||||||||
| Direction Deg. | NW 325° | NW 326° | NNW 334° | NNW 346° | NNW 336° | NNW 337° | NW 317° | NW 316° | NW 310° | NW 317° | NW 308° | NW 307° | NW 319° | N 8° | NNE 19° | NNW 348° | NNW 337° | NNW 346° | NW 310° | NW 317° | W 281° | WNW 289° | WNW 282° | NW 312° | NNW 346° | E 89° | NW 313° | NW 319° | NNW 344° | N 2° | N 352° | NNW 341° |
| Humidity (%) | 75.6 | 76.5 | 75.7 | 75.1 | 76.4 | 75.9 | 74.6 | 75.1 | 75.4 | 76.6 | 78.7 | 79.4 | 80.6 | 80.9 | 82.0 | 81.4 | 81.5 | 83.5 | 82.8 | 82.9 | 83.0 | 81.7 | 81.2 | 84.4 | 84.7 | 83.6 | 81.2 | 79.7 | 78.9 | 79.0 | 78.1 | 76.5 |
| Rain (mm) | - | - | - | - | - | - | - | - | - | - | - | - | - | - | - | - | - | - | - | - | - | - | - | - | - | - | - | - | - | - | - | - |
| Temp. (°C) | 7.5 | 7.4 | 7.6 | 7.8 | 7.6 | 7.4 | 7.2 | 7.0 | 6.9 | 6.6 | 6.2 | 6.1 | 6.0 | 6.7 | 6.6 | 6.8 | 6.7 | 6.6 | 6.2 | 6.1 | 5.6 | 5.5 | 5.4 | 5.8 | 6.4 | 6.9 | 6.9 | 6.6 | 6.7 | 6.8 | 7.0 | 7.0 |
| Time | 15h | 16h | 17h | 18h | 19h | 20h | 21h | 22h | 23h | Sun | 01h | 02h | 03h | 04h | 05h | 06h | 07h | 08h | 09h | 10h | 11h | 12h | 13h | 14h | 15h | 16h | 17h | 18h | 19h | 20h | 21h | 22h |
| Speed | 5.8 | 5.3 | 5.3 | 7.2 | 6.1 | 5.6 | 3.9 | 5.6 | 5.8 | 5 | 6.1 | 4.2 | 3.3 | 3.9 | 5.3 | 6.4 | 6.4 | 6.4 | 6.4 | 6.4 | 5.6 | 5.8 | 5 | 5.3 | 5 | 4.7 | 4.2 | 3.1 | 4.4 | 3.9 | 3.6 | 3.1 |
| Gust (m/s) | 9.7 | 11.1 | 9.7 | 11.4 | 10.3 | 9.7 | 7.8 | 10.6 | 9.7 | 9.7 | 10.3 | 8.9 | 6.1 | 7.5 | 10.6 | 10.6 | 9.4 | 9.7 | 10.3 | 11.1 | 8.9 | 10.6 | 8.9 | 8.1 | 7.5 | 7.2 | 6.9 | 5.8 | 9.4 | 6.1 | 5.8 | 5.8 |
| Direction | ||||||||||||||||||||||||||||||||
| Direction Deg. | NW 321° | NW 321° | NW 314° | NW 308° | NW 307° | NW 308° | WNW 302° | WNW 296° | WNW 285° | W 281° | WNW 296° | NW 305° | WNW 297° | WNW 299° | NW 317° | NNW 328° | NNW 332° | NNW 334° | NW 326° | NW 306° | NW 325° | NW 316° | NW 315° | NNW 335° | NNW 336° | NNW 336° | NNW 329° | NNW 335° | NNW 331° | NW 317° | NW 306° | NW 324° |
| Humidity (%) | 73.1 | 79.3 | 80.2 | 74.2 | 69.1 | 71.0 | 69.4 | 69.7 | 67.7 | 71.2 | 76.6 | 83.2 | 89.1 | 89.4 | 87.0 | 84.1 | 83.6 | 82.7 | 78.7 | 69.3 | 66.2 | 63.6 | 58.8 | 59.7 | 59.0 | 57.2 | 55.1 | 54.4 | 61.4 | 62.1 | 61.0 | 69.7 |
| Rain (mm) | - | - | - | - | - | - | - | - | - | - | - | - | - | - | - | - | - | - | - | - | - | - | - | - | - | - | - | - | - | - | - | - |
| Temp. (°C) | 8.5 | 7.8 | 7.3 | 6.5 | 6.4 | 6.4 | 7.0 | 6.3 | 6.2 | 5.6 | 5.4 | 4.9 | 4.1 | 4.3 | 5.0 | 5.6 | 5.7 | 6.0 | 6.4 | 7.1 | 7.5 | 8.2 | 8.9 | 8.8 | 9.1 | 9.4 | 9.7 | 9.7 | 9.4 | 9.5 | 9.1 | 8.0 |
Graphs
ZOOM
3 h
6 h
12h
1 d
5 d(max)
Synchronized zoom
updated: 06:55:07 Mon CEST
- Wind speed (m/s)
- Wind direction (°deg)
- Temperature & Dew Point (°C)
- Humidity (%)
Scroll down or click here to load graphs.
Scroll down or click here to load graphs.
Scroll down or click here to load graphs.
Scroll down or click here to load graphs.
- Light
Scroll down or click here to load graphs.
- Rain(mm)
Scroll down or click here to load graphs.
- Standard Pressure (hPa)
Scroll down or click here to load graphs.