Cascajera/UGR-ACAMET

Spain, Málaga, Igualeja, 1235m (AMSL) |SHOW ON MAP|
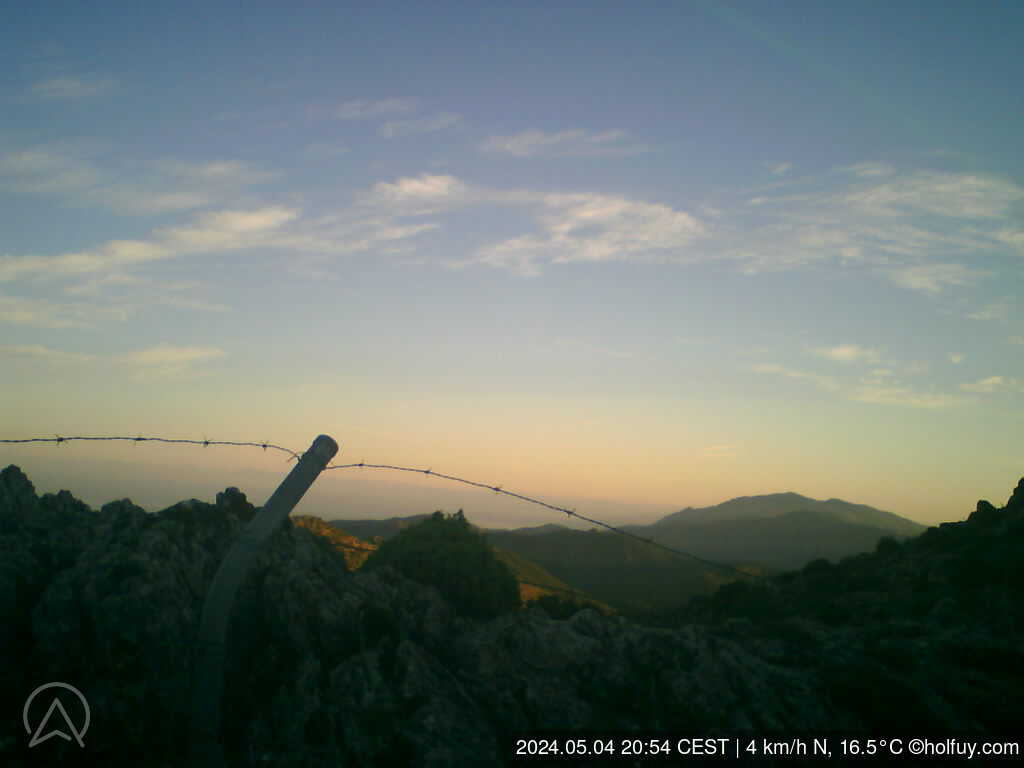
Cerro Cascajeras (Sierra Blanca de Igualeja)
07:26-21:26 (CEST)
Cerro Cascajeras (Sierra Blanca de Igualeja)
07:26-21:26 (CEST)
Page views in 2026: 3692
Note: Calculated from yearly data where the average wind speed is more than 4km/h.
Loading...
Averages updated: 20:14:07 Sat CEST
| Time | 12:15 | 12:30 | 12:45 | 13h | 13:15 | 13:30 | 13:45 | 14h | 14:15 | 14:30 | 14:45 | 15h | 15:15 | 15:30 | 15:45 | 16h | 16:15 | 16:30 | 16:45 | 17h | 17:15 | 17:30 | 17:45 | 18h | 18:15 | 18:30 | 18:45 | 19h | 19:15 | 19:30 | 19:45 | 20h |
| Speed | 11 | 9 | 6 | 7 | 9 | 10 | 7 | 9 | 11 | 9 | 9 | 8 | 8 | 7 | 7 | 9 | 7 | 8 | 8 | 8 | 7 | 5 | 6 | 6 | 7 | 6 | 6 | 6 | 5 | 6 | 3 | 3 |
| Gust (km/h) | 20 | 25 | 16 | 21 | 19 | 26 | 21 | 23 | 26 | 22 | 27 | 23 | 20 | 19 | 16 | 21 | 23 | 19 | 20 | 17 | 19 | 15 | 16 | 22 | 20 | 19 | 17 | 17 | 15 | 21 | 17 | 13 |
| Direction | ||||||||||||||||||||||||||||||||
| Direction Deg. | S 186° | SSW 197° | SSW 200° | SSW 196° | SSW 197° | SSW 199° | SSW 208° | SSW 199° | S 186° | SSW 199° | S 183° | SSW 206° | SSW 207° | SSW 194° | SSW 207° | S 191° | S 191° | S 189° | S 189° | SSW 196° | S 190° | SSW 210° | S 188° | SSW 197° | SSW 202° | SSW 201° | SSW 195° | SSW 199° | SSW 200° | SSW 206° | SSW 204° | SW 224° |
| Humidity (%) | 30.3 | 33.5 | 33.1 | 31.9 | 30.0 | 28.8 | 28.6 | 28.9 | 28.6 | 27.9 | 26.6 | 27.0 | 27.3 | 26.7 | 26.9 | 26.6 | 26.1 | 26.7 | 27.6 | 28.7 | 29.3 | 29.8 | 30.6 | 32.1 | 32.6 | 33.2 | 33.6 | 35.0 | 36.5 | 38.3 | 39.7 | 40.8 |
| Rain (mm) | - | - | - | - | - | - | - | - | - | - | - | - | - | - | - | - | - | - | - | - | - | - | - | - | - | - | - | - | - | - | - | - |
| Soil Temp (°C) | 24.1 | 24.4 | 24.9 | 25.3 | 25.7 | 25.9 | 26.1 | 26.5 | 26.7 | 26.9 | 27.0 | 27.2 | 27.4 | 27.6 | 27.6 | 27.8 | 28.0 | 28.2 | 28.2 | 28.4 | 28.4 | 28.4 | 28.4 | 28.4 | 28.4 | 28.4 | 28.2 | 28.2 | 28.2 | 28.0 | 27.9 | 27.7 |
| Temp. (°C) | 30.7 | 30.7 | 30.7 | 31.3 | 31.8 | 32.0 | 32.4 | 32.6 | 32.7 | 32.8 | 33.3 | 33.1 | 33.5 | 33.9 | 34.0 | 33.8 | 33.6 | 34.0 | 33.7 | 33.6 | 33.3 | 33.4 | 33.3 | 32.8 | 32.4 | 32.2 | 32.0 | 31.6 | 31.2 | 30.5 | 29.8 | 29.3 |
| Time | 05h | 06h | 07h | 08h | 09h | 10h | 11h | 12h | 13h | 14h | 15h | 16h | 17h | 18h | 19h | 20h | 21h | 22h | 23h | Sat | 01h | 02h | 03h | 04h | 05h | 06h | 07h | 08h | 09h | 10h | 11h | 12h |
| Speed | 4 | 1 | 0 | 0 | 0 | 1 | 1 | 1 | 3 | 3 | 4 | 5 | 5 | 5 | 4 | 3 | 1 | 0 | 1 | 5 | 6 | 5 | 5 | 8 | 13 | 12 | 5 | 7 | 7 | 5 | 9 | 10 |
| Gust (km/h) | 13 | 7 | 0 | 4 | 3 | 7 | 8 | 10 | 15 | 17 | 15 | 19 | 17 | 17 | 16 | 11 | 9 | 3 | 10 | 17 | 16 | 15 | 13 | 25 | 33 | 35 | 19 | 26 | 20 | 14 | 22 | 22 |
| Direction | ||||||||||||||||||||||||||||||||
| Direction Deg. | E 92° | E 95° | E 95° | E 95° | E 95° | E 95° | E 95° | E 93° | ESE 115° | SE 128° | SSE 156° | S 174° | S 188° | S 188° | S 189° | S 190° | S 191° | S 191° | S 191° | SSE 162° | SE 137° | SE 142° | SE 143° | S 177° | SSW 202° | S 184° | S 184° | S 188° | S 185° | S 187° | S 188° | S 186° |
| Humidity (%) | 41.1 | 43.3 | 44.2 | 45.6 | 41.5 | 37.9 | 34.6 | 29.5 | 28.3 | 31.2 | 34.2 | 38.9 | 39.7 | 40.5 | 44.0 | 38.7 | 45.1 | 51.2 | 46.3 | 41.1 | 37.8 | 38.7 | 37.5 | 34.5 | 31.2 | 28.2 | 32.1 | 34.0 | 33.8 | 33.8 | 33.6 | 33.2 |
| Rain (mm) | - | - | - | - | - | - | - | - | - | - | - | - | - | - | - | - | - | - | - | - | - | - | - | - | - | - | - | - | - | - | - | - |
| Soil Temp (°C) | 22.0 | 21.8 | 21.1 | 20.6 | 20.9 | 21.3 | 22.7 | 23.7 | 24.7 | 25.7 | 27.1 | 28.2 | 28.6 | 28.7 | 28.5 | 27.5 | 26.6 | 25.5 | 24.8 | 24.5 | 24.2 | 24.1 | 24.0 | 23.6 | 23.5 | 23.3 | 23.2 | 23.0 | 22.8 | 23.1 | 23.5 | 23.7 |
| Temp. (°C) | 24.6 | 23.8 | 22.3 | 22.5 | 24.2 | 26.6 | 29.0 | 31.0 | 31.5 | 32.4 | 33.3 | 33.2 | 33.3 | 33.5 | 32.3 | 32.3 | 29.4 | 28.0 | 27.2 | 28.0 | 28.3 | 27.9 | 27.3 | 27.6 | 28.0 | 27.6 | 26.8 | 26.2 | 26.4 | 27.5 | 28.1 | 28.8 |
Graphs
ZOOM
3 h
6 h
12h
1 d
5 d(max)
Synchronized zoom
updated: 20:14:07 Sat CEST
- Wind speed (km/h)
- Wind direction (°deg)
- Temperature (°C)
- Humidity (%)
Scroll down or click here to load graphs.
Scroll down or click here to load graphs.
Scroll down or click here to load graphs.
Scroll down or click here to load graphs.
- Soil moisture (%)
Scroll down or click here to load graphs.
- Light
Scroll down or click here to load graphs.
- Rain(mm)
Scroll down or click here to load graphs.
- Standard Pressure (hPa)
Scroll down or click here to load graphs.